Triplot
triplot(in::Matrix; onlyedges::Bool=false, noplot::Bool=false, kw...)
Plot the 2-D triangulation or Voronoi polygons defined by the points in a matrix
Args
in: The input data. Can be either a Mx2 or Mx3 matrix.
Kwargs
noplot: Return the computed Delaunay or Veronoi data instead of plotting it (the default).onlyedges: By default we compute Delaunay tringles or Veronoi cells as polygons. Use this option asonlyedges=trueto compute multiple line segments.region: Sets the data region (xmin,xmax,ymin,ymax) forvoronoi(required). If not provided we compute it fromin.voronoi: Compute Voronoi cells instead of Delaunay triangles (requiresregion).kw...: keyword arguments used in the $plot$ module (ignore ifnoplot=true).
Returns
A GMTdataset if noplot=true or $nothing$ otherwise.
Example:
triplot(rand(5,2), voronoi=true, show=true)

triplot(rand(5,3), lc=:red, show=true)
Delaunay triangulation
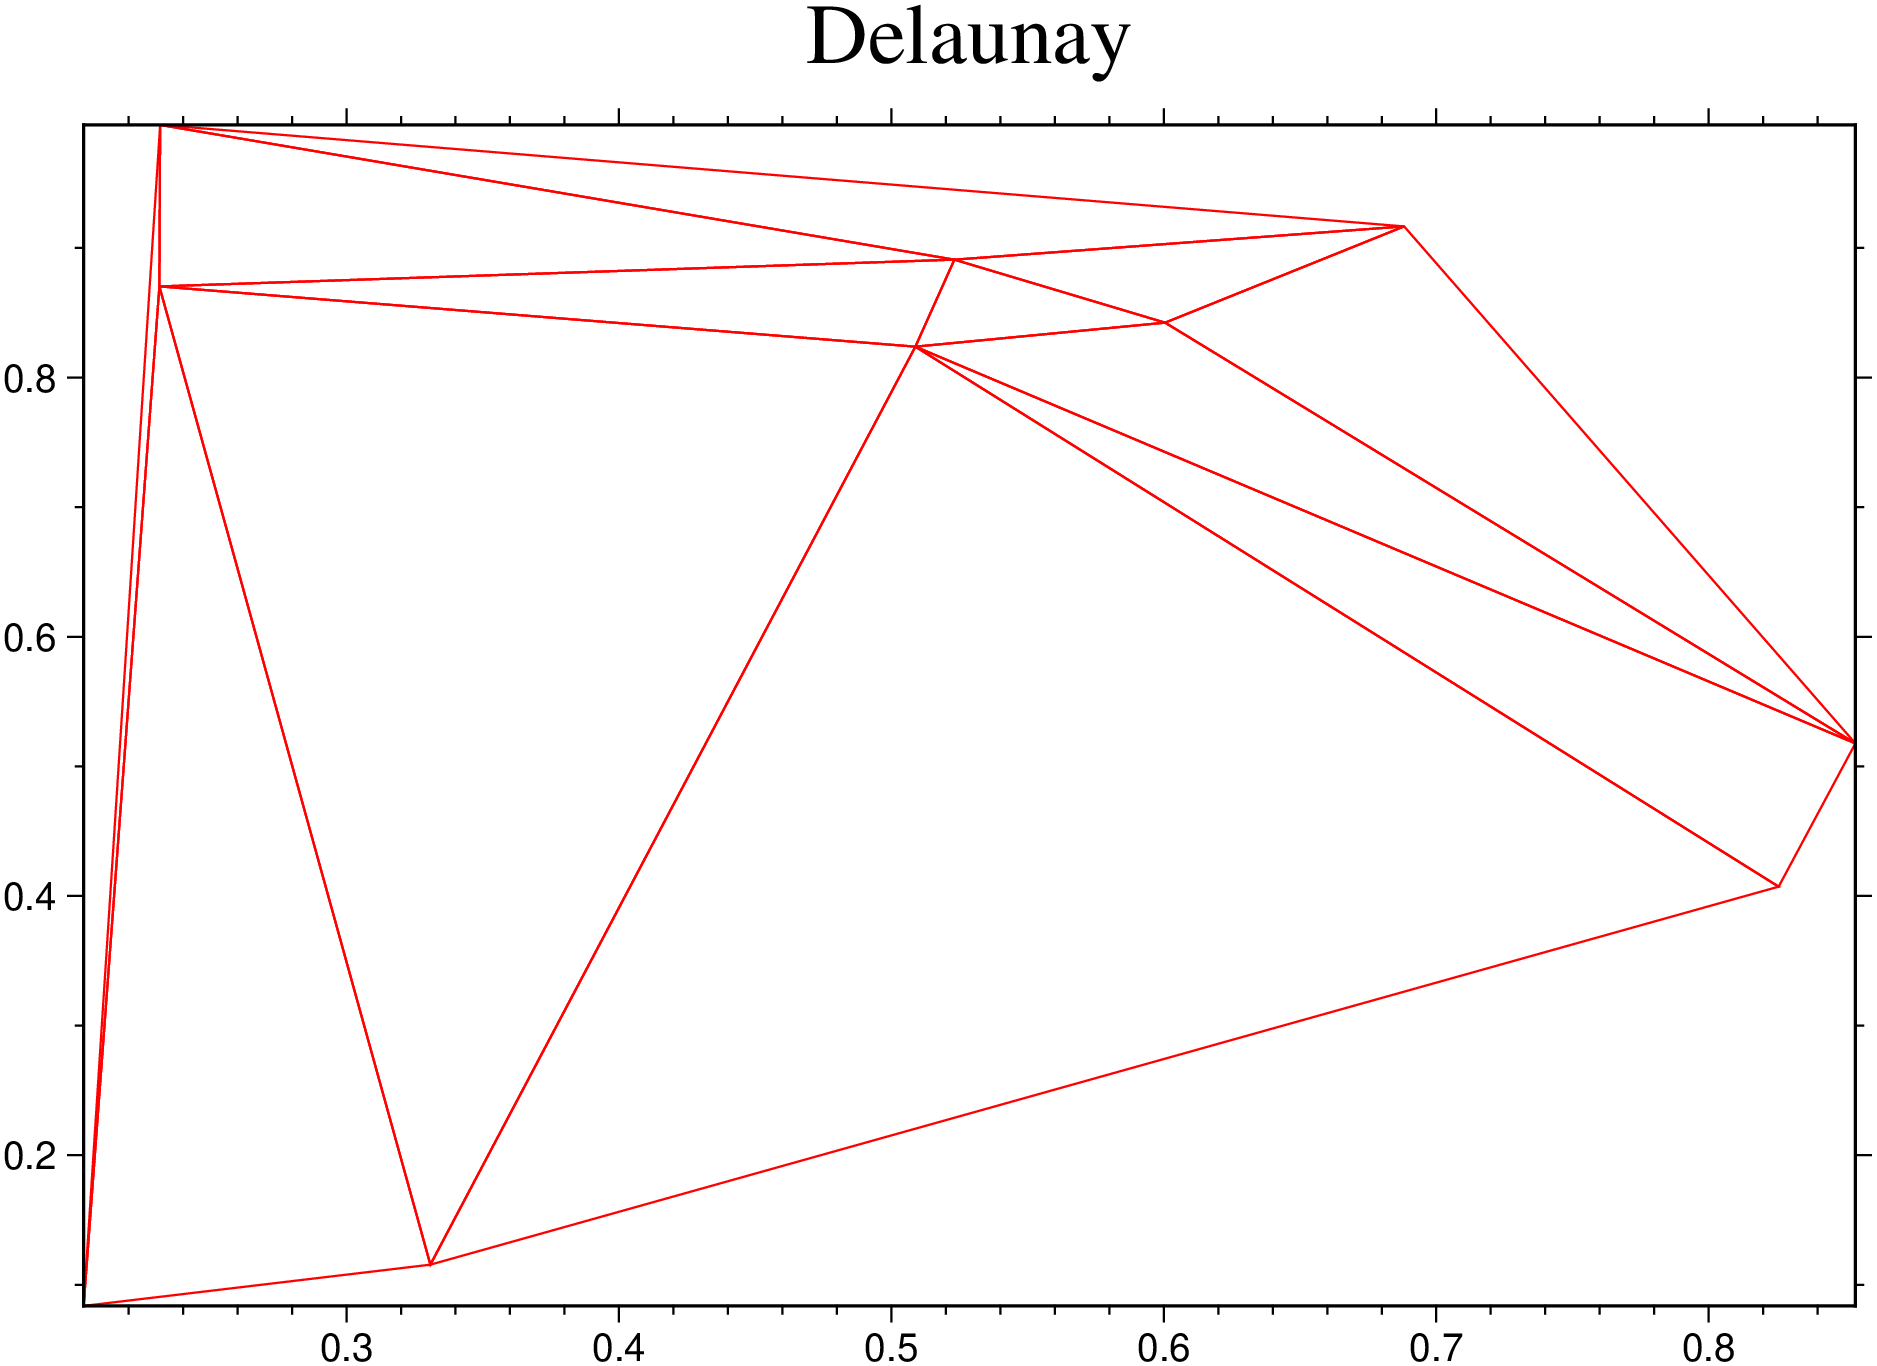
using GMT
triplot(rand(10,3), lc=:red, title="Delaunay", show=true)
These docs were autogenerated using GMT: v1.33.1